Visualize connections between notes in Joplin.
| Links: | |
|---|---|
| Maintainers: | sepremento |
| Version: | 1.1.1 |
| Minimum app version: | 3.2.12 |
| Downloads: This version: | 42 |
| Last updated: | 2025-02-12T10:48:37Z |
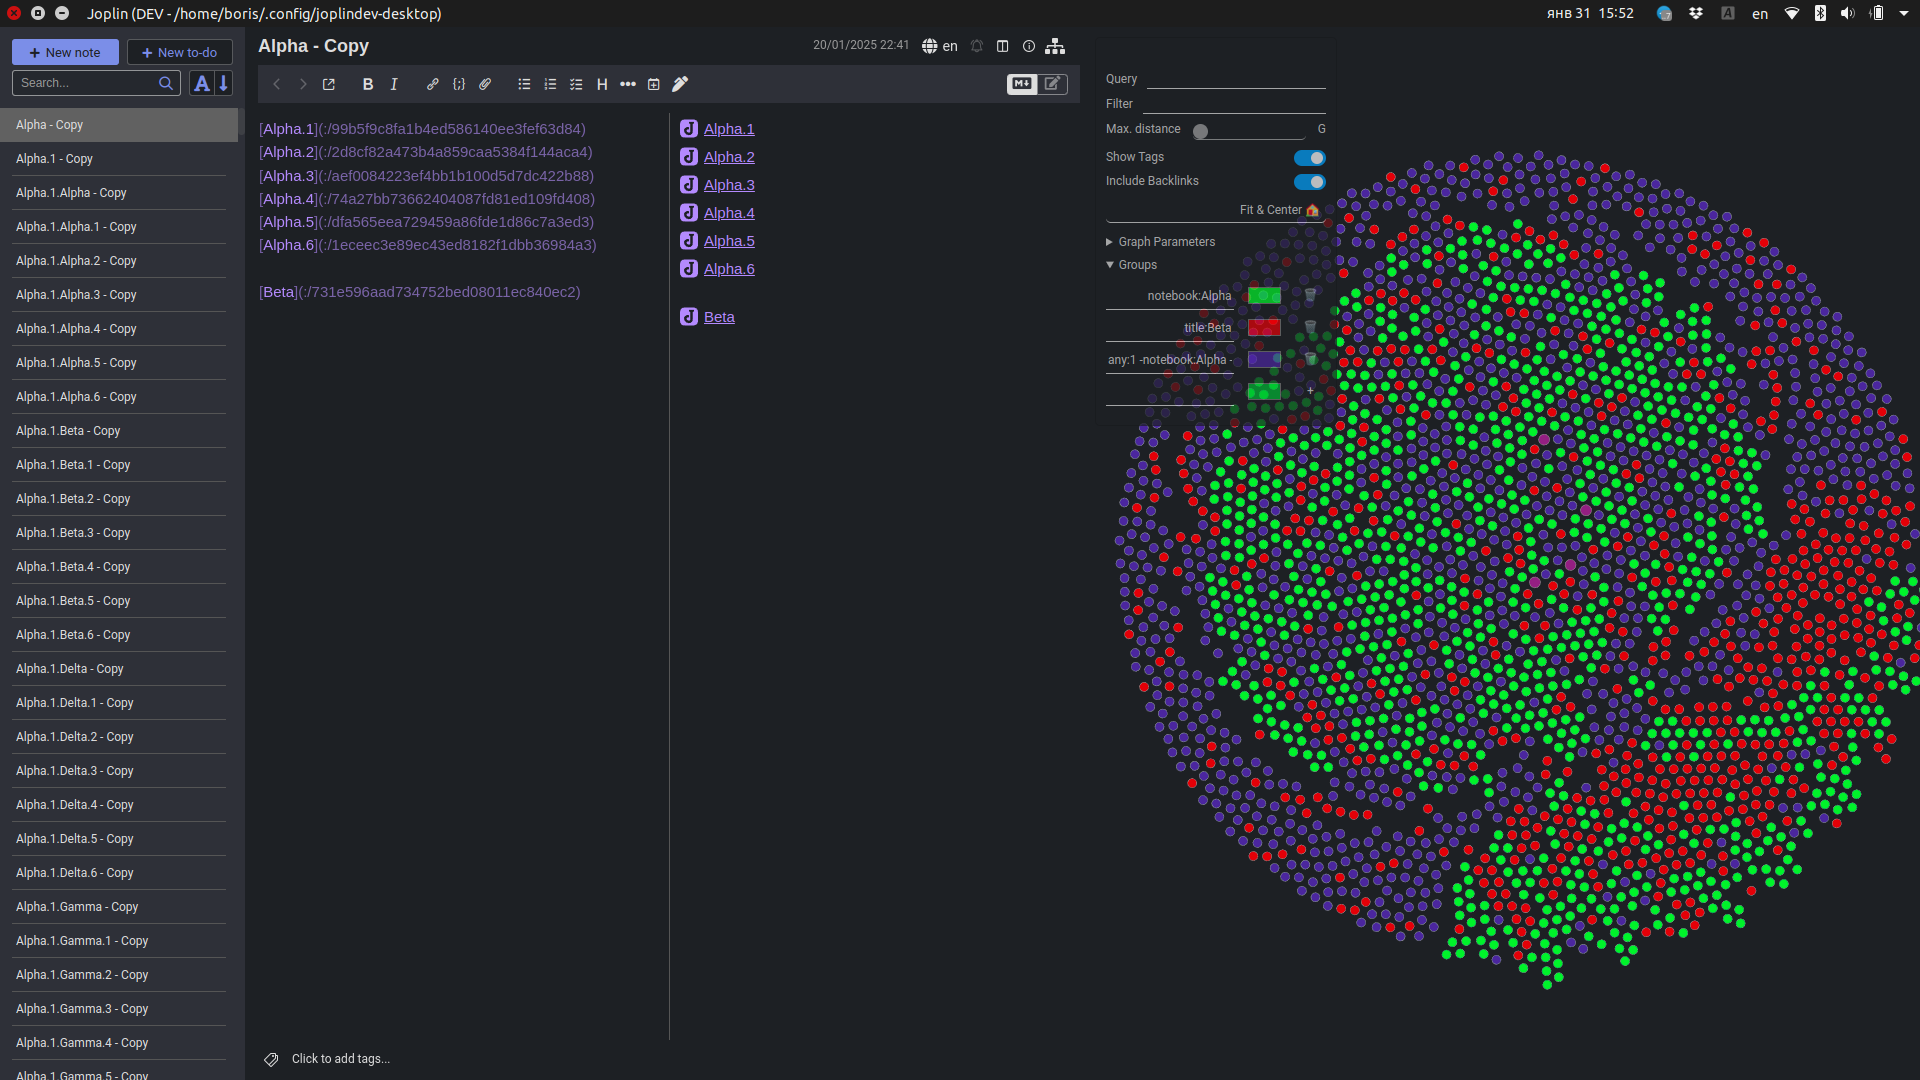
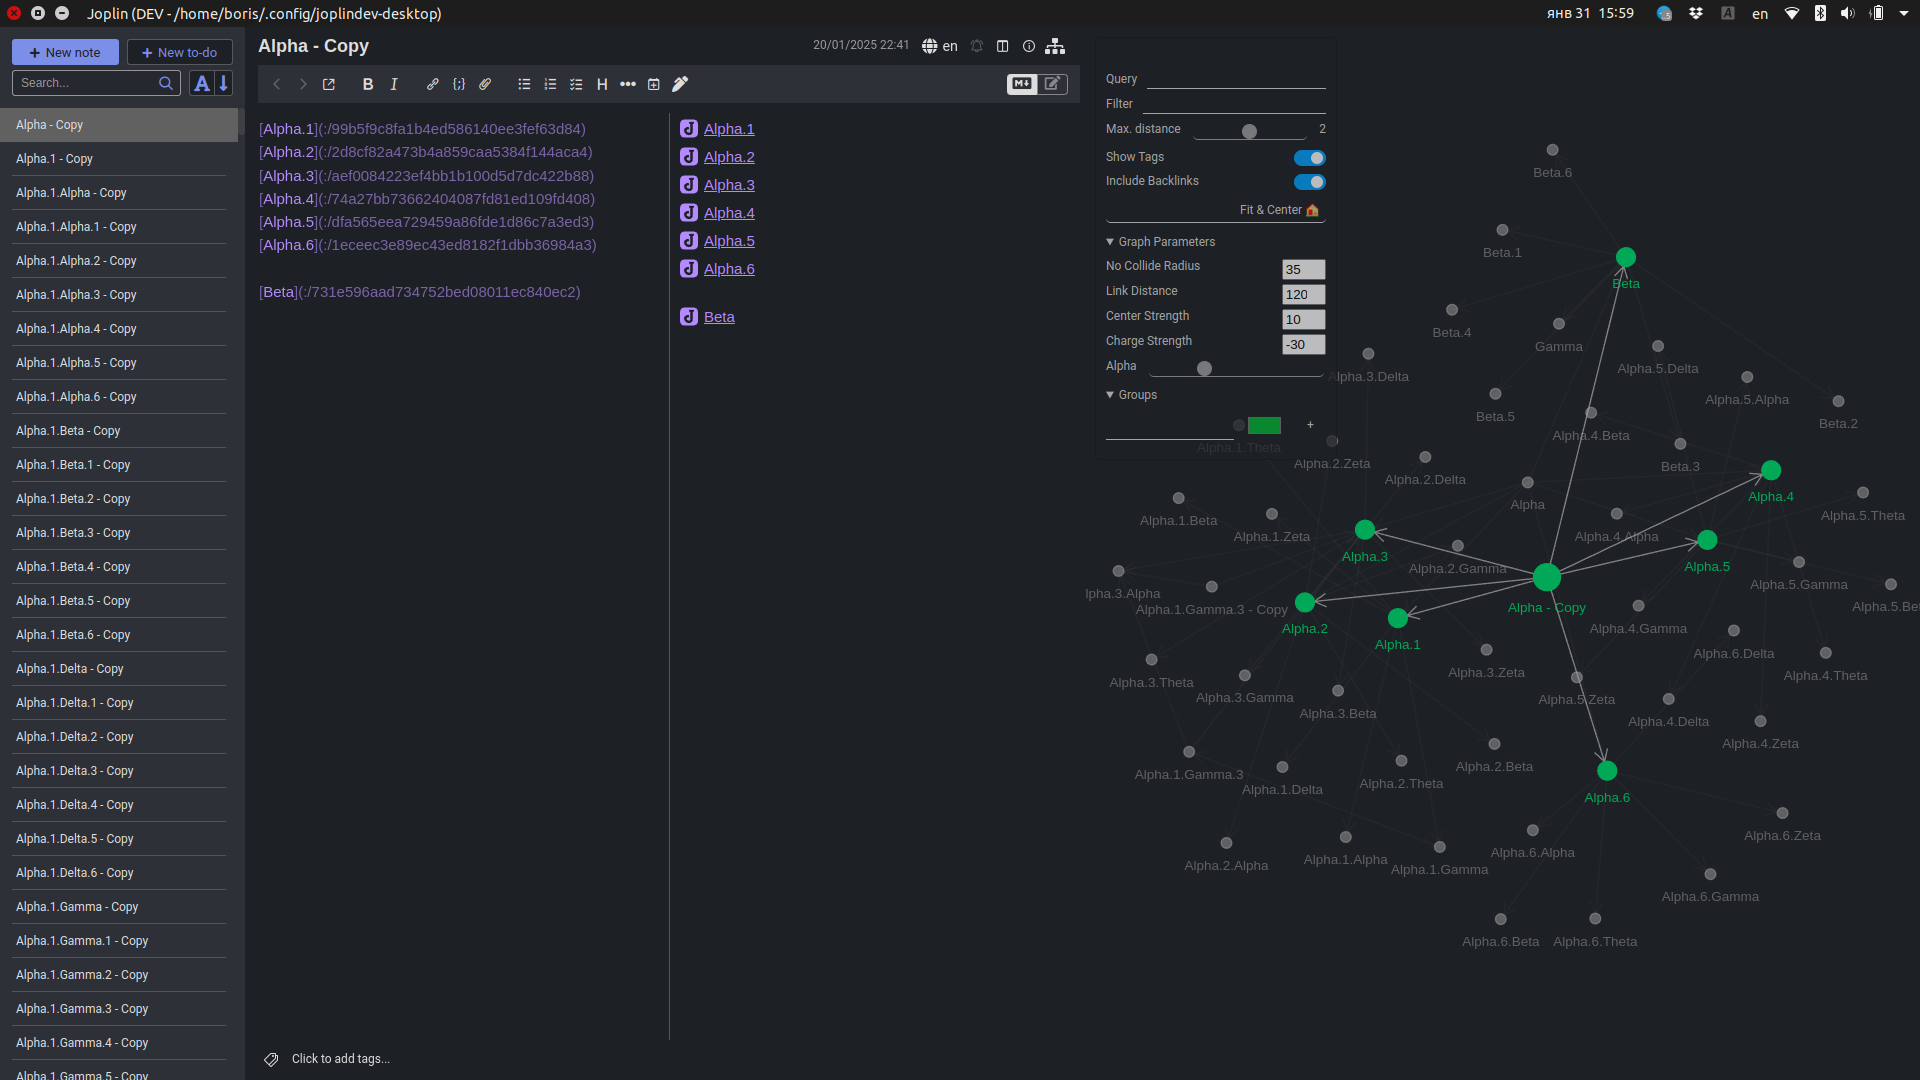
This plugin provides a graph for the connections between notes in your Joplin databse. The graph is interactive and configurable. See Features below.
It was initially a fork of @treymo Link Graph UI plugin but quickly have developed into a creature of its own. Some pieces of code remained untouched so as the structure of the app.
This plugin was developed for my personal use and my taste. It works best with Dark theme. Also I am a recreational developer in TypeScript and Web so no rigorous testing was introduced. However pugin does a very decent job for me.
There are some known bugs that I hope to fix in future.
Max. distance slider to set tree depth between 0 and
5. Zero is like "Global view" in Obsidian, all notes are displayed.CTRL-LeftClick.Enter. Query syntax
is Joplin search syntax.Enter. All
notes that satisfy the condition in the "Filter" input field are EXCLUDED from the graph.Enter
or click the + button.Enter,
otherwise the filter would not be updated.Note: Requires Joplin 1.7.0+
https://github.com/user-attachments/assets/3b9d0786-83f7-4f9e-8c5d-2eb87b6f532f
cd into the repository and run npm install to install dependencies.npm run dist to build the plugin file.keywords: joplin-plugin